Counting Co-
Now, the state medical bureaucrats didn't inspire much confidence, but theirs were (and are) the only figures available on local conditions. Conveniently, if you signed up, they sent around an email message every day, then every weekday, with the latest counts. That made it relatively easy for me to keep up my tables. I was especially interested in hospitalizations and intensive care unit patients with the disease. Overall case numbers were interesting, but as they depended on the vagaries of testing, I saw them as less trustworthy (and I still do).
Anyway, come April 1 of this year, the weekday emails stopped. And between that, widespread vaccinations, and fewer hospitalizations even during a huge case spike, I gave up on my homemade spreadsheets. The last of the homespun charts I posted were here.
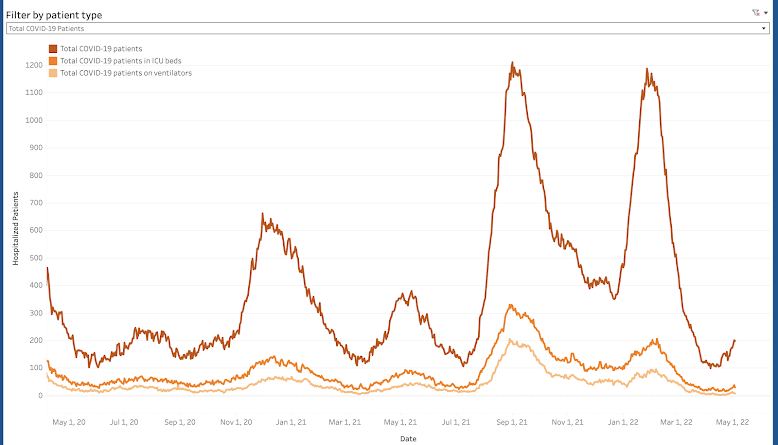
I thought I'd check in with the state website last night to see how things are going a month later. You can get to some vague hospital data here, but what you really want is the current Covid hospital patient tally, which is here.
The charts show that things are picking up again at the hospitals around the state, although thank heaven, the ICU numbers remain way down:
You can also get daily state and county case counts here, although at this point, you wonder if those are worth much, other than general trends. Most significantly, at-home test results are not reflected there.
The state website is full of other data that to somebody like me, is no longer useful, if it ever was. But when those hospitalization curves start rising, the bureaucrats have my full attention.
I'm glad my little Excel project has come to a close. There are better things to do. But I'm not sorry I kept it going when I did.


Thanks for doing this, Jack. At least you’ve boned up on your Excel graphing skills!
ReplyDeleteOAS (original antigenic sin) is happening. We wont know how bad, but the current trend is heading in the wrong direction.
ReplyDeleteCareful with those spreadsheets, BoJack. Biden’s new DGB might accuse you of spreading disinformation.
ReplyDeleteRemember when they said 'we'll be greeted as liberators' & the Iraq invasion would be over in 2-3 weeks / 'mission accomplished!'?
ReplyDeleteKinda thought the same thing w/the feasibility of 'flattening the curve' & what a 'quarantine' would even mean in america at the time?
Good for you to keep track. 'excess deaths' is such a broad brush.
It's really hospitalizations w/confirmed tests, otherwise who knows what you're really looking at, exactly?
& when it is in the news & the news gets people worried, more people get or report tests of one kind of another LOL.
Seems like people aren't in the ICU/dyin' as much this time, in terms of what, if anything, can be determined with this latest ski-jump...
'We've heard this before' lol
ReplyDelete